If you have trouble viewing this email, please click here.
The Brode Report
The Brode Report | Sep 2016

David BrodeHi,

My but these months go by quickly! Here's a piece on my analysis of Olympics results--it's surprising how a bit of analysis changes the outcomes. Hmm, what could that be an analogy for?

Best,

David

I created a short video where I describe some unique features of a financial model that I developed for a client that raised over $350 million. You can see it at brodetelecom.com/model-overview.


Who Won the Rio 2016 Olympics?

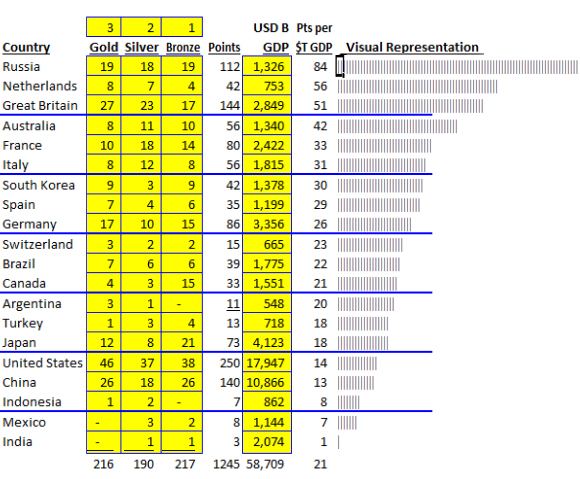
You might think it was the US, with the most golds and medal points, followed by the UK, China, and Russia. The top ten nations are shown here:

Medal Standings

Source: Google “Rio Medal Count” accessed on 8/26/16.

Longtime readers of this newsletter know this isn’t the first time I’ve looked at the Olympics. I did before for the games in London 2012 and Sochi 2014. I still believe what I wrote four years ago:

While I like seeing the US come out on top, it does strike me as a bit of an unfair analysis. Is it really fair to compare Australia (pop. 22M) to China (pop. 1.3B)? It sure seems right to adjust for population. Also, we all know that funding matters, so it seems like average wealth should be a factor. Conveniently, Population x GDP per Capita = GDP, and it’s pretty easy to find data on GDP for countries to match up against the Olympic results.

On that basis, I looked at the Top 20 economies, which account for 85% of world GDP. Ranking is by Points per Trillion Dollars of GDP. On this basis Russia and the UK move up, while China and the US fall back. In fact, the US falls to twelfth place, nearly 1/6th as efficient as Russia at getting medals.

Now the Top 20 economies here account for 81% of world GDP. (Note Saudia Arabia is actually the 20th largest economy, but I substituted Argentina (#21) here because S.A. won no medals.) As before, Russia wins by far. It’s interesting to note that the population is a bit less than half of the US population, but the GDP is 1/13th the size. So given that the R2 between GDP and Medal Points is 73% for these top-20 economies, the fact that Russia outperforms by 4x is remarkable. And that’s after ⅓ of the team was kept home due to the doping scandal.

The US drops to 16th place and actually underperforms this index by 33%.

medal index

Others have picked up on the idea of the alternative medal count. The Telegraph in the UK ranks by country GDP as we do here, and also look at medals per pop and per olympic team size.

In the alternative cases (except for team size), Jamaica looks really good, and shouldn’t we just thank Usain Bolt for existing?

It turns out that a Google team worked on this, too. Read their article about alternative medal rankings here by a Google team working on this, too. Their output pages are available as well. I notice that their GDP ranking differs from mine significantly, but I’ll leave it as an exercise to the reader to determine why. My data files are here.

Share this story.

LinkedIn Connect with me | Share your thoughts | Subscribe | See past issues | www.brodegroup.com
The Brode Group
Strategic Financial Consulting - Real-World Results
(303) 444-3300